59 focus
FOCUS
/ OBIETTIVI DEL MILLENNIO
Nel grafico:
rapporto urbano / rurale, per la quota di popolazione con
migliori strutture di servizi igienico-sanitari, tra il 1990 e il 2010
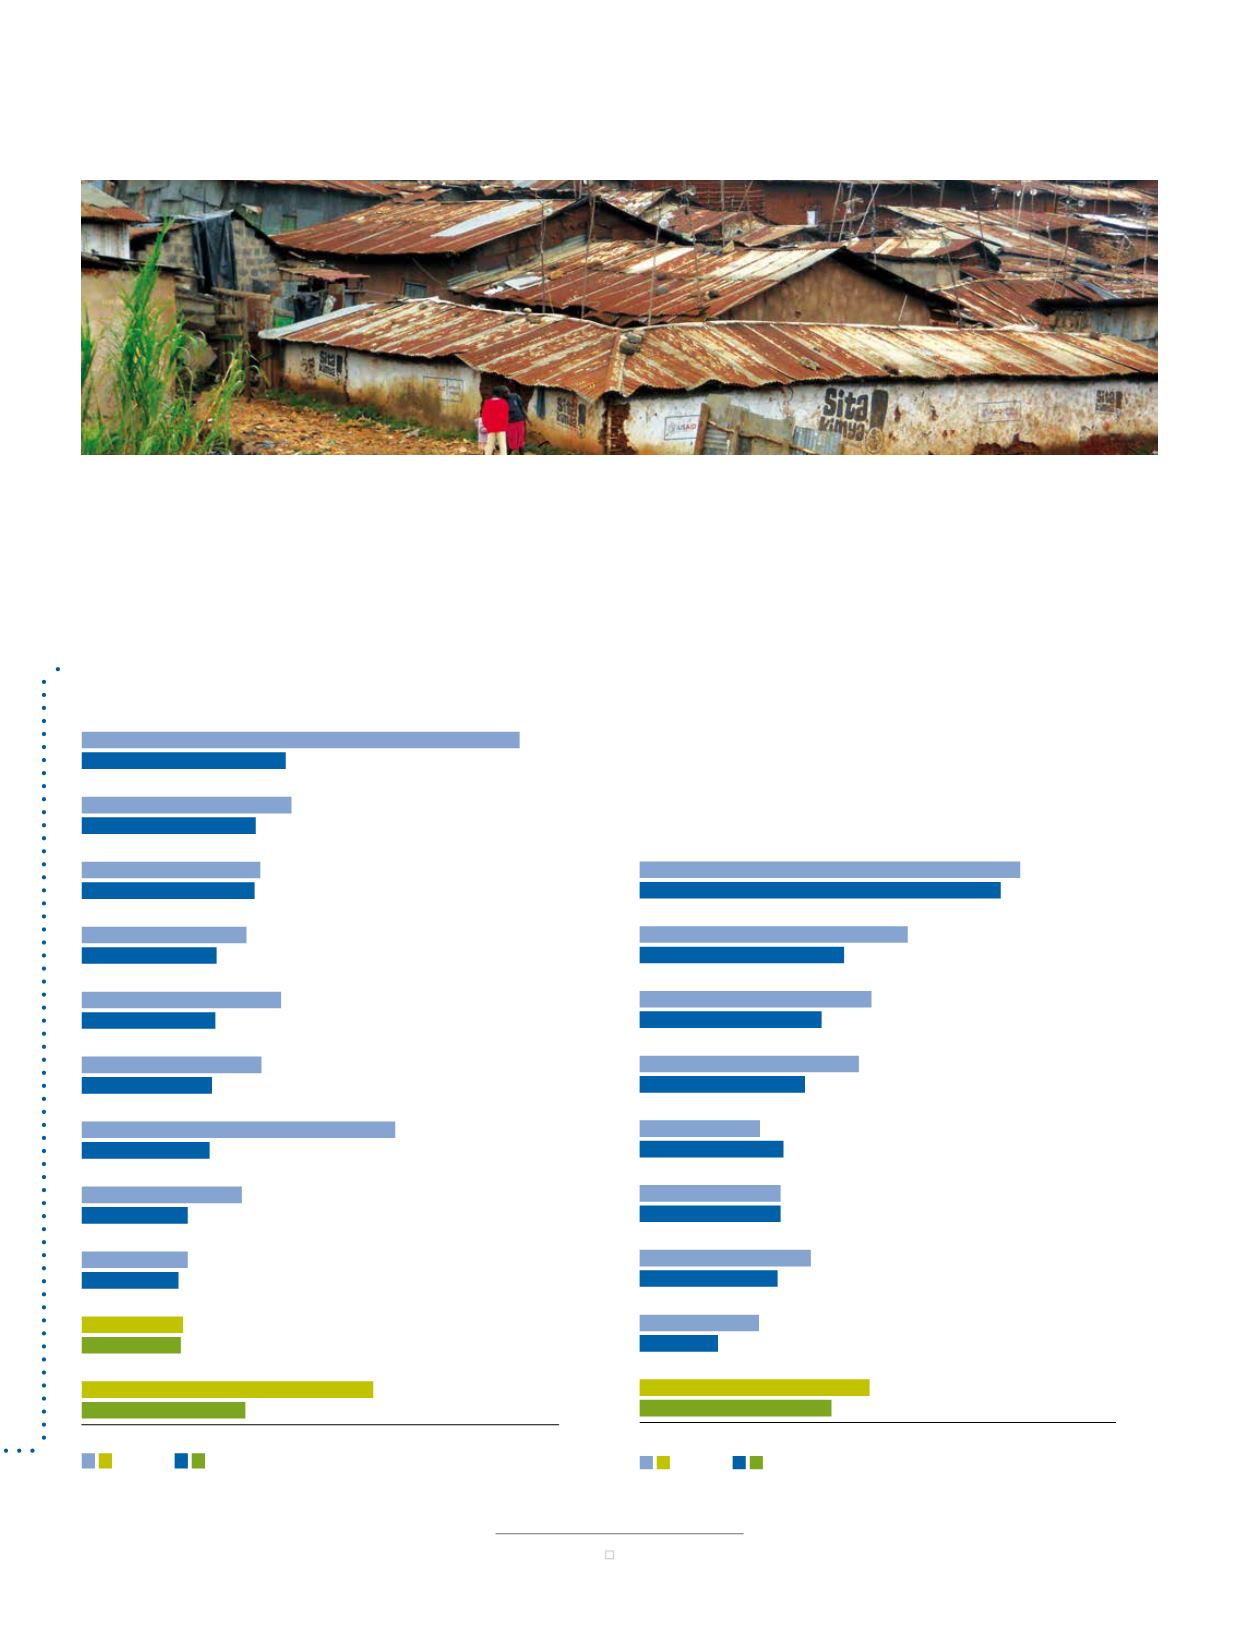
OBIETTIVO: ENTRO IL 2020, AVER RAGGIUNTO UN SIGNIFICATIVO MIGLIORAMENTO
NELLE ESISTENZE DI ALMENO 100 MILIONI DI ABITANTI DELLE BARACCOPOLI
PORTARE MIGLIORAMENTI NELLA VITA DEI
200 MILIONI DI ABITANTI DELLE BARAC-
COPOLI COME RAGGIUNGIMENTO DELL'O-
BIETTIVO OMS, ANCHE SE LA RAPIDA
URBANIZZAZIONE INGROSSA LE FILE DEI
POVERI URBANI
Nel grafico:
proporzione tra la popolazione che vive nelle baraccopoli
tra il 2000 e il 2012
56
|
THE MILLENNIUM DEVELOPMENT GOALS REPORT 2012
Urban–rural differences in sanitation
coverage are starting to even out, but
remain stark
1990
2010
Urban/rural ratio for the pr portion of the population using
an improved sanitation facility, 1990 d 2010
1.7
1.0
1.0
1.1
1.3
1.4
1.4
1.4
1.8
1.8
2.1
3.1
1.1
1.1
1.7
3.3
1.9
2.1
1.7
1.9
2.2
4.6
0
1
2
3
4
5
Developing regions
Developed regions
Caucasus & Central Asia
Northern Africa
Eastern Asia
South-Eastern Asia
Latin America & the Caribbean
Western Asia
Oceania
Sub-Saharan Africa
Southern Asia
Rural–urban disparities in access to sanitation are even
more pronounced than for access to drinking water. Eight
out of ten people use an improved sanitation facility in
cities around the world, compared to only half of the rural
population in the countrysides.
TARGET
By 2020, to have achieved a significant
improvement in the lives of at least 100 million
slum dwellers
Improvements in the lives of 200 million
slum dwellers bring achievement of the
MDG target, even as rapid urbanization
swells the ranks of the urban poor
2000
2012
Proportion of urban population living in slums, 2000 and
2012 (Percentage)
33
13
24
24
25
28
31
35
62
39
20
29
24
21
37
40
46
65
0
20
40
60
80
Developing Regions
Northern Africa
Latin America & the Caribbean
Oceania
Western Asia
Eastern Asia
South-Eastern Asia
Southern Asia
Sub-Saharan Africa
The share of urban slum residents in the developing world
declined from 39 per cent in 2000 to 33 per cent in
2012. More than 200 million of these people gained
56
|
THE MILLENNIUM DEVELOPMENT GOALS REPORT 2012
Urban–rural differences in sanitation
coverage are starting to even out, but
remain stark
1990
2010
Urban/rural ratio for the proportion of the population using
an improved sanitation facility, 1990 and 2010
1.7
1.0
1.0
1.1
1.3
1.4
1.4
1.4
1.8
1.8
2.1
3.1
1.1
1.1
1.7
3.3
1.9
2.1
1.7
1.9
2.2
4.6
0
1
2
3
4
5
Developing regions
Developed regions
Caucasus & Central Asia
Northern Africa
Eastern Asia
South-Eastern Asia
Latin America & the Caribbean
Western Asia
Oceania
Sub-Saharan Africa
Southern Asia
Rural–urban disparities in access to sanitation are even
more pronounced than for access to drinking water. Eight
out of ten people use n improved san tation facility in
cities around the world, compare to o ly h lf of the rural
population in the countrysides.
Fully 72 per cent of all those lacking access to improved
sanitation live in rural areas, as do 90 per cent of those
TARGET
By 2020, to have achieved a significant
improvement in the lives of at least 100 million
slum dwellers
Improvements in the lives of 200 million
slum dwellers bring achievement of the
MDG target, even as rapid urbanization
swells the ranks of the urban poor
2000
2012
Proportion of urban p pulation living in slums, 2000 and
2012 (Percentage)
33
13
24
24
25
28
31
35
62
39
20
29
24
21
37
40
46
65
0
20
40
60
80
Developing Regions
Northern Africa
Latin America & the Caribbean
Oceania
Western Asia
Eastern Asia
South-Eastern Asia
Southern Asia
Sub-Saharan Africa
The share of urban slum residents in the developing world
declined from 39 per cent in 2000 to 33 per cent in
2012. More than 200 million of
se p o le aine
access to improv d water sources, improved sanitation
facilities, or durable or less crowd d h usin , th reby


