FOCUS
/ OBIETTIVI DEL MILLENNIO
55 focus
La copertura con fonti sicure di acqua potabile per le popo-
lazioni rurali non è soddisfacente. Nel 2010, il 96% della
popolazione urbana utilizzava una fonte di acqua potabile
sicura, contro l’81% per cento della popolazione rurale.
In termini assoluti, a causa della crescita della popolazione,
il numero di persone senza acqua potabile nelle aree urbane
è effettivamente aumentato. Nelle zone rurali, invece, il nu-
mero di persone senza una fonte di acqua sicura è diminuito
da 1,1 miliardi nel 1990 a 653 milioni nel 2010.
Tuttavia, il divario tra aree urbane e rurali rimane ancora
ampio, con il numero di persone nelle zone rurali senza una
fonte d'acqua sicura cinque volte maggiore rispetto a quelle
urbane.
LE ZONE RURALI RISULTANOANCORA PIUTTOSTO INDIETRO NELL'ACCESSOALL'ACQUA,
RISPETTO A QUELLE URBANE
NELL’AFRICA SUB-SAHARIANA MOLTE PERSONE SONO SVANTAGGIATE NELL’ACCESSO
ALL’ACQUA POTABILE
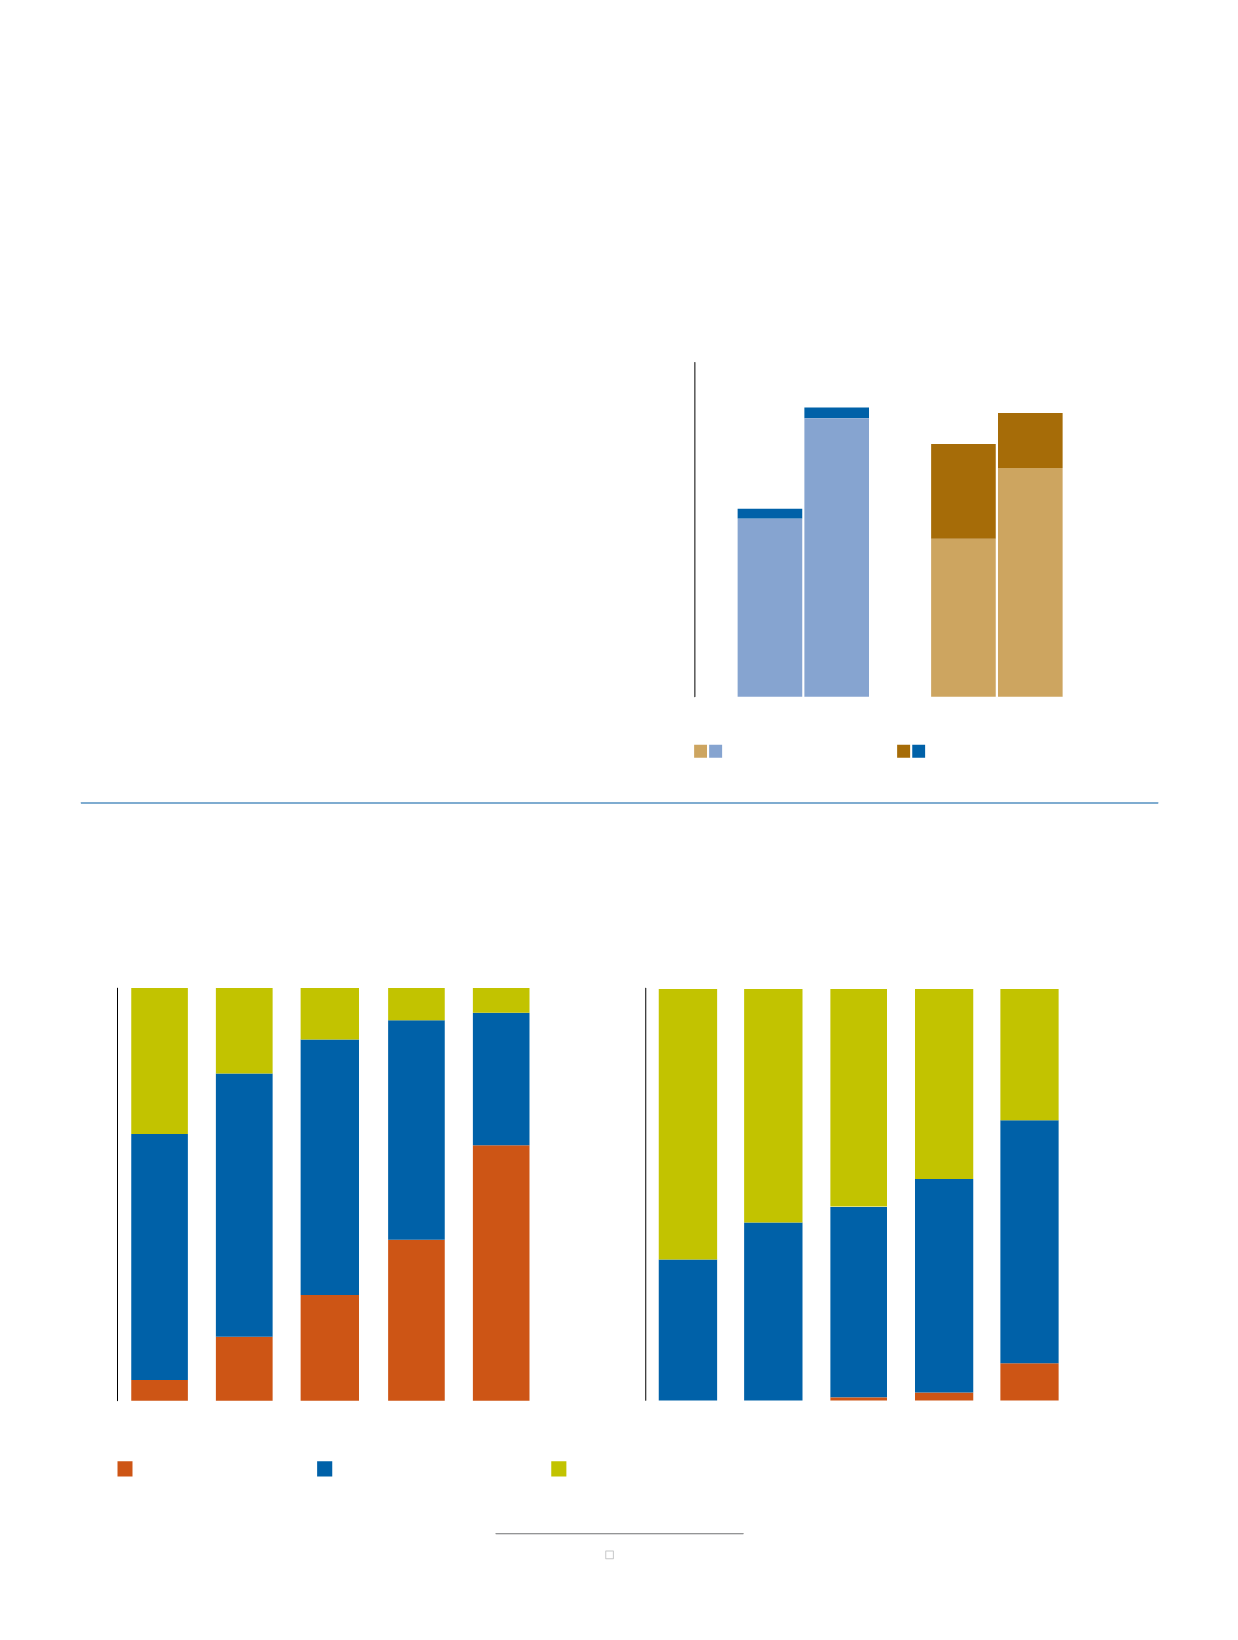
Nel grafico:
popolazione con e senza una fonte sicura di acqua pota-
bile, nel mondo, nelle città e nelle zone rurali, tra il 1990 e il 2010
Nel grafico:
percentuale di copertura dell’acqua potabile con riferimento alla ricchezza, nelle aree urbane e rurali, nell'Africa sub-sahariana,
basate sulla media ponderata della popolazione proveniente da 35 paesi
GOAL 7: EN
Rural areas are still far behind cities in water access
2,142
109
130
3,343
1,896
1,139
2,747
653
Population with and without an improved drinking water source,
world, urban and rural residence, 1990 and 2010 (Millions)
0
1,000
2,000
3,000
4,000
1990 2010
1990 2010
Not using improved sources
Using improved sources
Rural
Urban
Coverage
rural pop
of the urb
water sou
populatio
In absolut
number of
areas act
hand, the
source of
653 milli
and rural
people in
five times
Poorer people in sub-Saharan Africa are at a disadva
5
59
36
15
64
21
25
62
13
39
53
8
62
32
6
0
20
40
60
80
100
0
20
40
60
80
100
Poorest
20%
Second
20%
Middle
20%
Fourth
20%
Richest
20%
Unimproved sour
Other improved sources
Piped on premises
Po
2
Drinking water coverage by wealth quintiles, urban and rural residence, sub-Sahar
from 35 countries (Percentage)
Rur
Urban areas
Inequality remains a concern. An analysis of data from 35
countries in sub-Saharan Africa (representing 84 per cent
of the region’s population) shows significant differences
between the poorest and richest fifths of the population
in both rural and urban areas. Over 90 per cent of the
richest qui
and over
rural area
40 per c
populatio
GOAL 7: ENSURE ENVIRONMENTAL SUSTAINABILITY
|
53
Rural areas are still far behind cities in water access
2,142
109
130
3,343
1,896
1,139
2,747
653
Population with and without an improved drinking water source,
world, urban nd rural residence, 1990 and 2010 (Millions)
0
1,000
2,000
3,000
4,000
1990 2010
1990 2010
Not using improved sources
Using improved sources
Rural
Urban
Coverage with improved drinking water sources for
rural populatio s is still lagging. In 201 , 96 per cent
of the urban population used an improved drinking
water source, compared with 81 per cent of the rural
population.
In absolute terms, because of population growth, the
number of people without an improved source in urban
areas actually increased. In rural areas, on the other
hand, the number of people without an improved
source of water decreased, from 1.1 billion in 1990 to
653 million in 2010. However, the gap between urban
and rural areas still remains wide, with the number of
people in rural areas without an improved water source
five times greater than in urban areas.
Poorer people in sub-Saharan Africa are at a disadvantag in access to drinking water
5
59
36
15
64
21
25
62
13
39
53
8
62
32
6
0
20
40
60
80
100
34
66
43
57
9
59
32
52
46
2
0
20
40
60
80
100
46
53
1
Poorest
20%
Second
20%
Middle
20%
Fourth
20%
Richest
20%
Unimproved sources
Other improved sources
Piped on premises
Poorest
20%
Second
20%
Middle
20%
Fourth
20%
Richest
20%
Drinking water coverage by wealth quintiles, urban and rural residence, sub-Saharan Africa, based on population-weighted averages
from 35 countries (Percentage)
Rural areas
Urban areas
Inequality remains a concern. An analysis of data from 35
countries in sub-Saharan Africa (representing 84 per cent
of the region’s population) shows significant differences
between the poorest and richest fifths of the population
in both rural and urban areas. Over 90 per cent of the
richest uintile in urban areas use improved water sources,
and over 60 per cent h ve piped water on premises. In
rural areas, piped-in water is non-existent in the poorest
40 per c nt of households, and less than half of the
population use any form of improved source of water.
rbane
Buon uso dell risorse
Cattivo uso delle risorse
Rurali
Allaccio rete idrica
Aree urbane
Aree rurali
Altre fonti sicure
Fonti non sicure


