FOCUS
/ OBIETTIVI DEL MILLENNIO
51 focus
Nella cartina:
crescita delle aree protette tra il 1990 e il 2010 (Percentuale)
Per esempio, ci sono solo 588 siti Alliance for Zero Extinction
(Azes) che sostengono l’ultima popolazione restante di una o
più specie altamente minacciata. Il 51% di questi siti critici
sono totalmente privi di tutela, così come lo sono il 49% dei
10.993 Important Bird Areas (IBA).
Solo il 22% degli Azes e il 28% delle IBA sono completa-
mente tutelati tramite l’istituzione di aree protette.
Nella cartina:
crescita delle aree marine protette (a 12 miglia nautiche dalla costa) tra il 1990 e il 2010 (Percentuale)
TARGET
Reduce biodiversity loss, achieving, by 2010, a significant reduction in the rate of loss
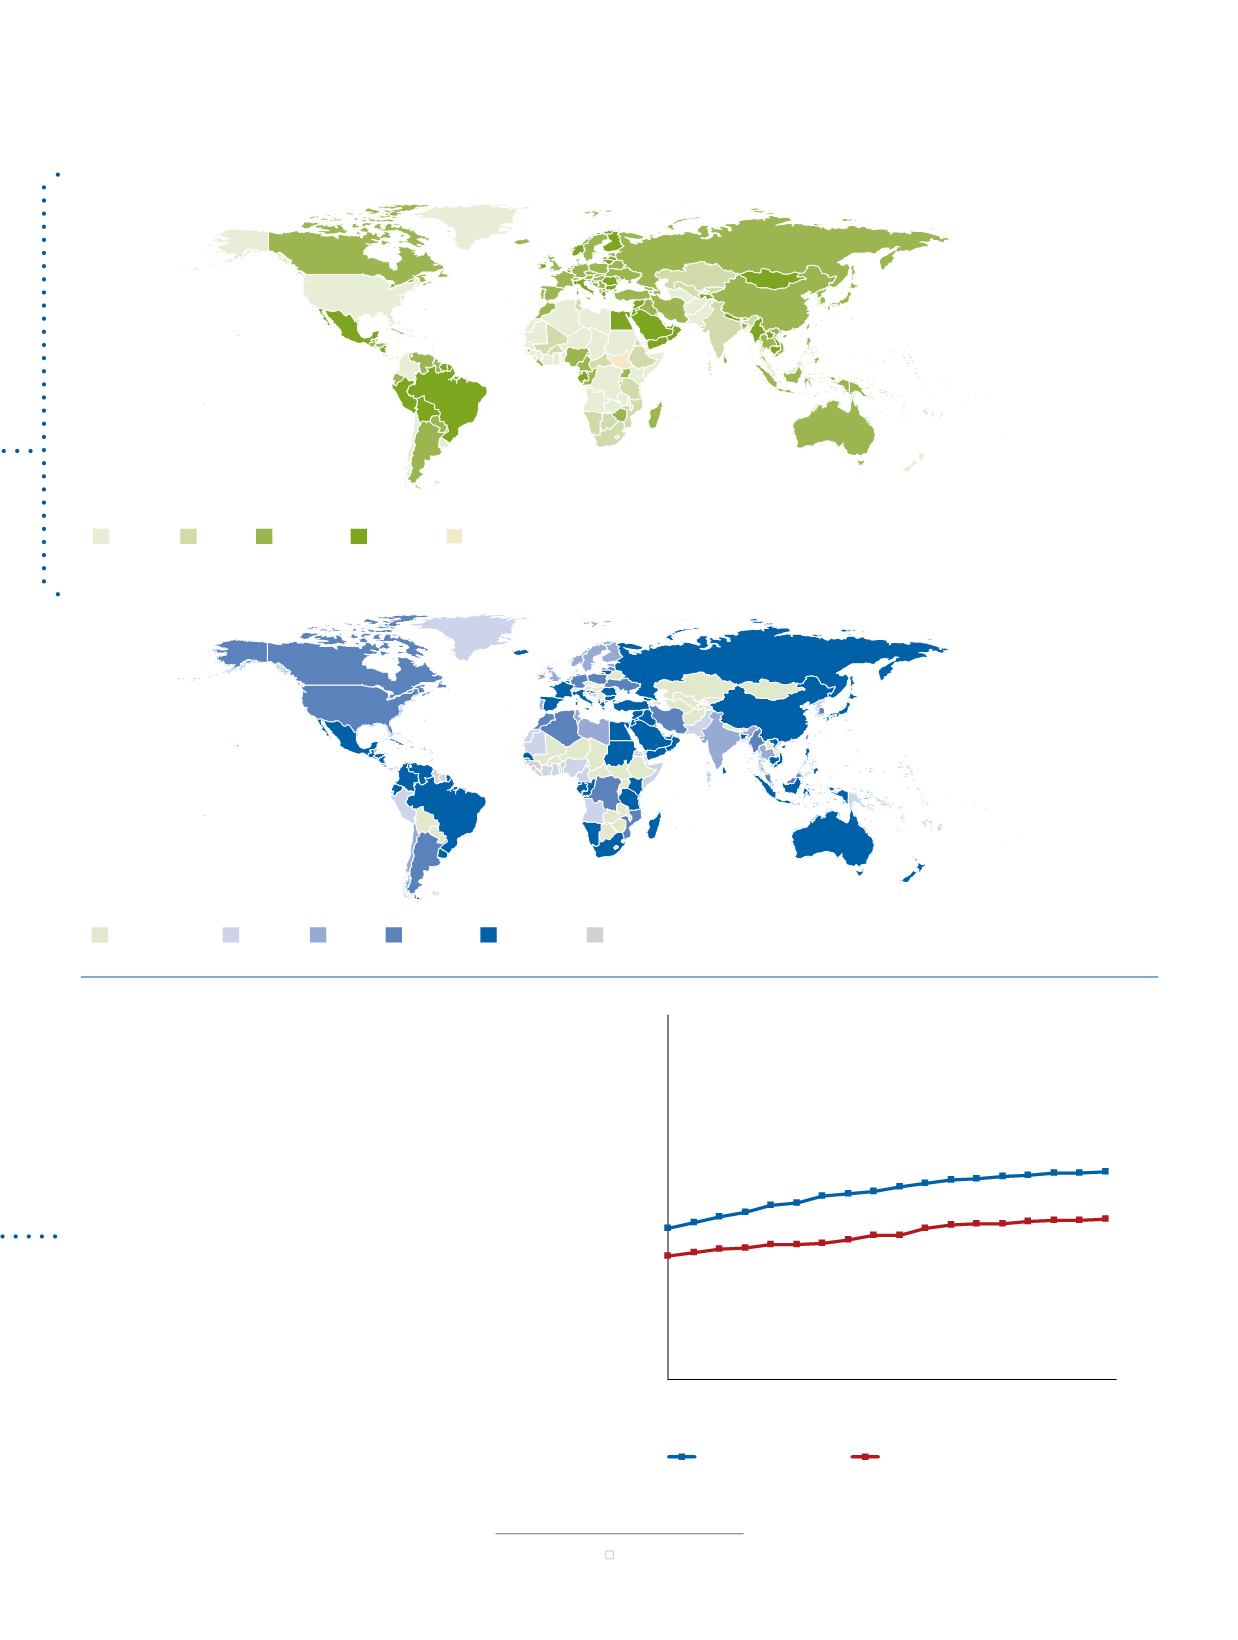
Biodiversity is still being lost, even as more areas of the earth’s surface are protected
Growth in terrestrial areas protected, 1990-2010 (Percentage)
Under 1 1 - 10 10 - 100 Over 100 No data available
Growth in marine protected area (up to 12 nautic l miles from l nd), 1990-2010 (Percentage)
Under 1 1 - 10 10 - 100 Over 100 No data available
No marine area
By 2010, protected areas covered 12.7 per cent of the
world’s land area, but such protection extended to only
1.6 per cent of the total ocean area.
Since 1990, protected areas have increased in number
by 58 per cent, and in their extent by 48 per cent. But
growth has varied widely across countries and territories.
Terrestrial protection doubled between 1990 and 2010
in 59 of 228 countries with available data, and marine
protection doubled in 86 of 172 countries with available
data. In contrast, growth of less than 1 per cent, or no
growth at all, occurred in the terrestrial protected area
system of 54 countries, and in the marine protected area
system of 35 countries.
Despite their relatively small extent, marine protected
areas have expanded at a faster pace than those on
land. The extent of protection increased especially in
costal waters out to 12 nautical miles—from 3.1 per cent
in 1990 to 7.2 per cent in 2010.
Reduce biodiversity loss, achieving, by 2010, a significant reduction in the rate of loss
i iv rsity is still i l st, v as
r ar as f t art ’s s rfac ar r t ct
rowth in terrestrial areas protected, 1990-2010 (Percentage)
Under 1 1 - 10 10 - 100 Over 100 No data available
rowth in marine protected area (up to 12 nautical miles from land), 1990-2010 (Percentage)
Under 1 1 - 10 10 - 100 Over 100 No data available
No marine area
By 2010, protected areas covered 12.7 per cent of the
orld’s land area, but such protection extended to only
1.6 per cent of the total ocean area.
Since 1990, protect d areas have increased in nu b r
by 58 per cent, and in their extent by 48 per cent. But
gro th has varied idely across countries and territories.
Terrestrial protection doubled bet een 1990 and 2010
in 59 of 228 countries ith available data, and arine
protection doubled in 86 of 172 countries ith available
data. In contrast, gro th of less than 1 per cent, or no
gro th at all, occurred in the terrestrial protected area
syste of 54 countries, and in the arine protected area
system of 35 countries.
Despite their relatively s all extent, arine protected
areas have expanded at a faster pace than those on
land. The extent of protection increased especially in
costal aters out to 12 nautical iles fro 3.1 per cent
in 1990 to 7.2 per cent in 2010.
50
|
THE MILLENNIUM DEVELOPMENT GOALS REPORT 2012
Cons
at wh
extinc
IUCN Re
populati
birds, ob
0.915
0.918
0.919
0.916
0.917
0.920
0.921
0.922
19
IUCN Re
in popul
mammal
0.862
The most important sites for species
conservation remain unprotected
Proportion of key biodiversity areas completely covered
by protected areas, 1990-2007 (Percentag )
0
10
20
30
40
50
1990 1992 1994 1996 1998 2000 2002 2004 2007
Important Bird Areas
Alliance for Zero Extinction sites
Note:
Data refer to 10,993 Important Bird Areas and 588 Alliance
for Zero Extinction sites.
New research has confirmed that appropriately located
protected areas can reduce declines in status of species.
But despite an increase in these areas, half of the world’s
Nel grafico a destra:
ar e cruciali per la biodiversità, co pl tamente
ricoperte da aree protette, 1990-2007 (Percentuale)
Nota:
i dati i riferiscono alle 10.993 are di riserva pe i volatili e ai
588 siti di "Alleance for Zero Extinction"
Riserve per volatili (IBA)
Siti prot tti "Alliance for Zero Ex inction
Meno di 1
Dati non disponi ili
Meno di 1
Dati non disponibili
essuna riserva


